Spring Boot 4 + OpenTelemetry: from the Java agent to the native integration

Alejandro Alonso Noguerales
May 28, 2026
In the first part of this series I talked about the concept: the three signals, OpenTelemetry as a standard, the promise of “instrument once, choose backend later”. All crystal clear on a whiteboard.
When it came to setting it up for the ERP, things got real. The integration worked, but several intermediate decisions weren’t covered by the official quickstart. And once I got to the backend, I found out something the OTel pitch suggests but is hard to see until you actually try it: the apps no longer know which one is running. The same demo boots against ELK or against the Grafana OSS stack without touching a single line of Java.
That’s what this post is about. How an HTTP request and a Kafka message get traced in Spring Boot 4 with the native OpenTelemetry integration, what you need to configure by hand beyond the starter, and what the same flow looks like in the two most common backends — so the choice between them becomes operational (team familiarity, license, ecosystem), not technical.
01 — From the Java agent to the native integration
My first attempt with OpenTelemetry was over a year ago, on Spring Boot 3. The “official” way to instrument back then was the OpenTelemetry Java agent: a JAR you download, hook into the JVM via the -javaagent flag, and let it inject instrumentation into the library bytecode at runtime.
It worked. Traces, metrics and logs were correlated. But several things didn’t sit right.
The first was the model itself: a piece of code external to your artifact, downloaded separately, that modifies the application bytecode at runtime. The technique is mature — APM vendors have used it for years — but it means the jar and the observability live in separate realities. The day something breaks, you have to wonder whether the problem is in your own code or in what the agent did to that code.
The second was operational. The agent is a binary you have to keep updated on its own. Versions that match the JVM, Spring Boot, the instrumented libraries. One more piece in the inventory, another dependency chain to track.
The third was about configuration. The agent is controlled through environment variables or a separate properties file. Wanting to condition behavior by environment — don’t export locally, export aggressively in pre-prod, sample in production — ended up as different startup scripts per environment.
Spring Boot 4 introduced spring-boot-starter-opentelemetry. One more dependency in the pom.xml. Configurable like any other starter, with application.yml, profiles, conditional properties. The agent goes away. The instrumentation comes from Spring libraries that hook into the extension points Spring already had for Micrometer.
02 — Two patterns cover most of it
When I started tracing the ERP, the first thing I saw was that two patterns cover the bulk of the traffic:
-
An HTTP request comes in and goes out. A controller receives the request, calls services, maybe queries a database, returns a response. All in the same process, all in the same thread (or close enough, if you use virtual threads or async). The trace is linear.
-
A Kafka message crosses processes. A producer publishes an event, the consumer receives it in another JVM and processes it. Here the trace has to hop from one process to another through the broker, which is where context propagation needs more care — and where the demo needs a specific patch on the consumer side, as we’ll see in section 04.
REST calls between services, JDBC, JPA, Redis — all variations of the first. Async calls, RabbitMQ, SQS — variations of the second.
There are cases that don’t fit cleanly into either: @Scheduled, long-lived SSE, WebSocket, Spring Batch. They exist — we have them in our own ERP — and they either reduce to one of the two underneath (SSE is HTTP, the WS handshake is HTTP), or they need manual instrumentation to be seen at the same level of detail. That’s why this post focuses on HTTP and Kafka: they’re the two patterns that cover the majority of the code you write and where the demo teaches something directly applicable. The rest go into section 09.
To show both in a single article, I built a demo with two Spring Boot 4 services connected through Kafka via Spring Cloud Stream:
order-api: receivesPOST /orders, exposes aSupplier<Flux<Message<Order>>>that the binder hooks into theorders.createdtopic. The controller pushes to the reactive sink.order-processor: exposes aFunction<Message<OrderMessage>, Message<ProcessedEvent>>that the binder connects toorders.created(in) andorders.processed(out). A single function to consume, persist, and emit the processed event.
The whole demo is in a public repo with docker compose to run it locally. Link at the end.
03 — What the starter gives you for free
The OpenTelemetry starter for Spring Boot 4 automatically instruments the most common pieces:
- HTTP server: every incoming request creates a parent span with method, path, status code and duration. If the client sends
traceparent(the W3C standard header), it’s linked to the existing trace; if not, a new one starts. - HTTP client (RestClient / WebClient): every outgoing call creates a child span and automatically propagates
traceparentto the destination service. - JDBC / JPA: every query is a span with the SQL it ran (configurable how much detail).
- Kafka producer: with
spring.cloud.stream.kafka.binder.enable-observation: true, everysend()injects the W3Ctraceparentheader into the message. Without the flag, the producer spans exist but the header doesn’t travel with the message. The biggest surprise while wiring this up was realizing the consumer side isn’t symmetric — I cover it in section 04, “Consumer-side Kafka propagation”. - JVM metrics: heap, GC, threads, classloader. The ones Micrometer already emitted, now in OTLP format.
- Logs: if you wire up the Logback appender (section 04, “Installing the Logback appender by hand”), every log line is automatically enriched with
trace_idandspan_id.
To turn all of that on, two things in your pom.xml:
<dependency>
    <groupId>org.springframework.boot</groupId>
    <artifactId>spring-boot-starter-opentelemetry</artifactId>
</dependency>
And a minimal block in application.yml:
spring:
  application:
    name: order-api
  cloud:
    stream:
      kafka:
        binder:
          enable-observation: true
  otel:
    exporter:
      otlp:
        endpoint: http://otel-collector:4318
A few seconds after the app boots, you’re already emitting traces, metrics and logs over OTLP to the Collector. No agent, no startup scripts, no magic configuration.
04 — What you have to configure by hand
The above is what every tutorial covers. But several details only come up when you take the integration to a real system.
How many OTel dependencies you actually need (spoiler: fewer than you’d think)
The first temptation when reading OTel docs is to add a pile of libraries: opentelemetry-api, opentelemetry-sdk, opentelemetry-runtime-telemetry-java17, opentelemetry-exporter-otlp, opentelemetry-logback-appender-1.0, opentelemetry-jdbc, opentelemetry-spring-kafka… The reality: with Spring Boot 4 you only need three, and only one of them needs special attention:
<dependency>
  <groupId>org.springframework.boot</groupId>
  <artifactId>spring-boot-starter-opentelemetry</artifactId>
</dependency>
<dependency>
  <groupId>io.opentelemetry</groupId>
  <artifactId>opentelemetry-exporter-otlp</artifactId>
</dependency>
<dependency>
  <groupId>io.opentelemetry.instrumentation</groupId>
  <artifactId>opentelemetry-logback-appender-1.0</artifactId>
</dependency>
What about the JVM runtime metrics? Micrometer emits them, it comes bundled with Actuator, and the starter wires it to the OTel SDK without you having to add anything. Confirmed by inspecting the documents in Elasticsearch: jvm.memory.used, jvm.threads.live, process.cpu.usage all come out with telemetry.sdk.name: io.micrometer. Adding opentelemetry-runtime-telemetry-java17 duplicates the same information under a different name.
And the JDBC, Spring Kafka, etc. instrumentation? Spring Boot already wires them through Observation. You only add OTel libraries when there’s a piece with no equivalent in Micrometer/Observation.
The only delicate point: aligning Logback bridge versions
Of the three dependencies, only one (opentelemetry-logback-appender-1.0) is alpha and needs an extra detail: it depends on opentelemetry-api 1.61.0, but Spring Boot 4.0.6 pins 1.55.0. Result: NoSuchMethodError on GlobalOpenTelemetry.getOrNoop() as soon as the app starts.
The fix is to import the instrumentation BOM before the Spring Cloud BOM:
<dependencyManagement>
  <dependencies>
    <dependency>
      <groupId>io.opentelemetry.instrumentation</groupId>
      <artifactId>opentelemetry-instrumentation-bom-alpha</artifactId>
      <version>2.27.0-alpha</version>
      <type>pom</type>
      <scope>import</scope>
    </dependency>
    ...
  </dependencies>
</dependencyManagement>
Once Spring includes the OTel appender in the starter itself (clearly where the roadmap is heading), the dependency and the BOM stop being necessary. Until then, this is the minimum you need.
Consumer-side Kafka propagation: you have to extract it by hand
The producer injects traceparent into the message header when enable-observation is on in the binder. So far, perfect. But the consumer side of Spring Cloud Stream Kafka in spring-cloud 2025.1.1 doesn’t extract that header into the OTel context automatically.
I checked by trying every reasonable flag: spring.kafka.template.observation-enabled, spring.kafka.listener.observation-enabled, spring.cloud.stream.kafka.binder.enable-observation, spring.cloud.function.observation-enabled, spring.cloud.stream.bindings.<x>.consumer.observation-enabled. None of them makes the consumer open the span with the message’s traceparent as parent. Result: every message starts a new trace, and the distributed correlation is lost.
The temporary fix is to extract the context by hand inside the Function:
@Bean
public Function<Message<OrderMessage>, Message<ProcessedEvent>> orderConsumer(OpenTelemetry openTelemetry) {
    return inputMessage -> {
        Context extracted = openTelemetry.getPropagators()
                .getTextMapPropagator()
                .extract(Context.current(), inputMessage.getHeaders(), HEADER_GETTER);

        try (Scope ignored = extracted.makeCurrent()) {
            // processing; since it's a Function, the returned message is
            // published to the -out-0 binding (orders.processed) and
            // inherits this context.
            return MessageBuilder.withPayload(...).build();
        }
    };
}
Where HEADER_GETTER is a 10-line TextMapGetter<MessageHeaders> adapter that reads from Spring’s MessageHeaders instead of the Map<String, String> that OTel expects by default.
With this, spans created inside the scope (JPA, the next topic’s producer) inherit the correct trace_id. The distributed trace is alive again.
It’s ugly and should disappear once this gap is fixed upstream — but today it’s the only reliable way I’ve found. Worth the six-line block in exchange for a full trace.
trace_id in logs before OTel kicks in
The starter puts trace_id and span_id into the MDC of every log… when there’s an active trace. But there are plenty of moments when an application logs without having gone through an HTTP controller or a Kafka consumer: startup, @Scheduled tasks, init jobs, configuration logs.
Those logs come out without trace_id. And when you need to diagnose something happening during startup or in a scheduled task, you’re back to filtering by timestamp and praying.
The fix in the ERP was a custom filter, CorrelationIdFilter, that always puts something into the MDC as early as possible:
- If the request carries an
X-Correlation-Idheader, use that. - If there’s already an active OTel
trace_id, use that. - Otherwise, generate a fresh UUID.
That filter runs before any other Spring filter. It’s the first one to touch the request. With it, any log emitted while processing a request always has an identifier to correlate by, whether OTel is involved or not.
Why it matters: in production you have requests coming from outside with their own trace IDs (other teams, gateways), internal requests that do go through OTel, and health-check requests you don’t want to trace. A single mechanism doesn’t cover all three. This filter does.
Installing the Logback appender by hand
The starter doesn’t automatically install Logback’s OpenTelemetryAppender. It’s available, but you have to wire it manually. In logback-spring.xml:
<appender name="OTEL" class="io.opentelemetry.instrumentation.logback.appender.v1_0.OpenTelemetryAppender">
    <captureExperimentalAttributes>true</captureExperimentalAttributes>
    <captureMdcAttributes>*</captureMdcAttributes>
</appender>

<root level="INFO">
    <appender-ref ref="CONSOLE"/>
    <appender-ref ref="OTEL"/>
</root>
And in code, register the appender against the global OpenTelemetry when the application starts:
@Bean
public ApplicationRunner installOtelLogAppender(OpenTelemetry openTelemetry) {
    return args -> OpenTelemetryAppender.install(openTelemetry);
}
Without this, logs go to console but never get exported via OTLP. It’s easy to lose a while wondering why Kibana isn’t receiving anything before stumbling on this detail.
Capturing exceptions so the Errors tab doesn’t stay empty
The starter instruments the HTTP server and opens a span per request. If the controller throws an exception that escapes the servlet container, that span ends with status=ERROR and the trace is marked as failed. Good.
But there’s a very common case that does NOT work: when a @RestControllerAdvice or any @ExceptionHandler catches the exception and returns a ResponseEntity. Spring resolves the error internally, the OTel filter sees a clean 400, and the span ends with status=UNSET. The Kibana APM Errors tab — or equivalent — stays empty even though the application is throwing exceptions constantly.
The fix is three lines in the global handler: record the exception manually on the current span before returning the response.
@RestControllerAdvice
public class GlobalExceptionHandler {

    @ExceptionHandler(MethodArgumentNotValidException.class)
    public ResponseEntity<...> handleValidation(MethodArgumentNotValidException ex) {
        Span span = Span.current();
        span.recordException(ex);
        span.setStatus(StatusCode.ERROR, ex.getClass().getSimpleName());
        return ResponseEntity.badRequest().body(...);
    }

    @ExceptionHandler(Exception.class)
    public ResponseEntity<...> handleAny(Exception ex) {
        Span.current().recordException(ex);
        Span.current().setStatus(StatusCode.ERROR, ex.getClass().getSimpleName());
        return ResponseEntity.status(500).body(...);
    }
}
recordException() adds a span event with the class, the message and the stack trace; setStatus(ERROR) marks the span as failed. That’s what the elasticapm processor in the Collector needs to emit the APM error document that populates the Errors tab, with error.grouping_key and a navigable stack trace. In Grafana, exactly the same: the “Errors by span” panel fills up with spans whose status.code=STATUS_CODE_ERROR.
Same applies to the Kafka consumer. When the Function throws, you have to record the exception by hand before rethrowing, or the ListenerExecutionFailedException that Spring Kafka wraps it in reaches the backend without a stack trace:
try {
    // processing...
    return MessageBuilder.withPayload(result).build();
} catch (RuntimeException ex) {
    Span span = Span.current();
    span.recordException(ex);
    span.setStatus(StatusCode.ERROR, ex.getClass().getSimpleName());
    throw ex;
}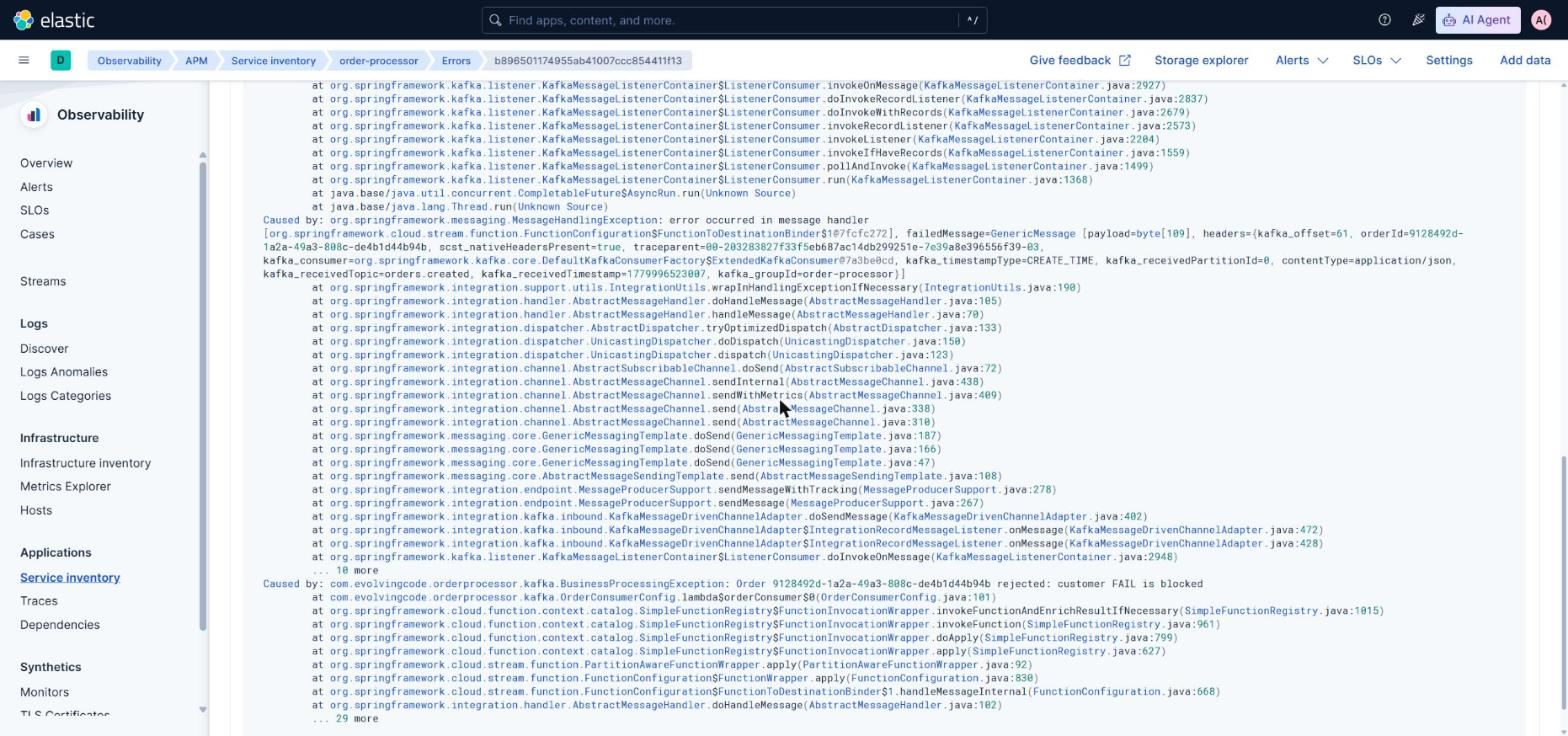
It’s one of those pieces the quickstart assumes but no example shows. Without it, traces exist but the Errors tab is decoration.
Business metrics: the same bus as the JVM ones
The starter wires Micrometer to the OTel SDK for the runtime metrics: heap, threads, GC, http server requests. What’s not as obvious is that any metric you emit through Micrometer rides the same bus. No extra library, no separate MeterProvider. A Micrometer Counter with the API you’ve always used ships over OTLP just like jvm.memory.used.
In the demo, every call to the endpoint emits a counter tagged with the outcome:
@Autowired MeterRegistry meterRegistry;

@PostMapping
public Map<String, Object> create(@Valid @RequestBody CreateOrderRequest req) {
    // ... publish to Kafka ...
    Counter.builder("orders.created.total")
            .tag("outcome", "accepted")
            .register(meterRegistry)
            .increment();
    return Map.of("orderId", id, "status", "ACCEPTED");
}
And from the @ExceptionHandler, with outcomes invalid_payload, malformed_json, server_error. Five minutes of code that show up in Prometheus or Elasticsearch — depending on the backend — as orders_created_total{outcome="accepted", service_name="order-api", ...}, with all the resource attributes the other metrics already carry.
Two things to keep in mind:
- You own the cardinality. The
outcomeattribute has four values; it’s safe. If you usedcustomer_idororder_idinstead, every combination would open a new time series and the cluster would melt within weeks. The rule is simple: unique identifiers in spans and logs only, never as metric attributes. - The name gets normalized on export.
orders.created.totalin Micrometer becomesorders_created_totalin Prometheus because of the namespace separator. In Elasticsearch the dot is preserved. It’s transparent: the API is always Micrometer.
This is what separates having runtime observability from having observability that’s useful to the business. “The service is up” means little to leadership; “X orders processed, Y rejected” reads itself and renders on a dashboard without building anything new.
Conditional profile to skip exporting locally
When working locally, you don’t want the application trying to export to http://otel-collector:4318 every time you start a test or a main. The OTel properties live in application-otel.yml, which only activates with the otel profile.
In docker-compose.yml, the apps boot with SPRING_PROFILES_INCLUDE=otel. In the IDE locally, no. Done.
Trivial when you read it, but it saves hours of “why are my integration tests so slow” before you realize each one is trying to talk to a Collector that doesn’t exist.
05 — What you see when a request comes in
Once everything is wired up, a POST /orders produces this cascade of spans, all sharing the same trace_id:
| Span | Service | Type |
|---|---|---|
http post /orders | order-api | Server (root) |
orders.created send | order-api | Producer (Kafka) |
orders.created process | order-processor | Consumer (Kafka) |
orderConsumer process | order-processor | Internal |
orders.processed send | order-processor | Producer (Kafka) |
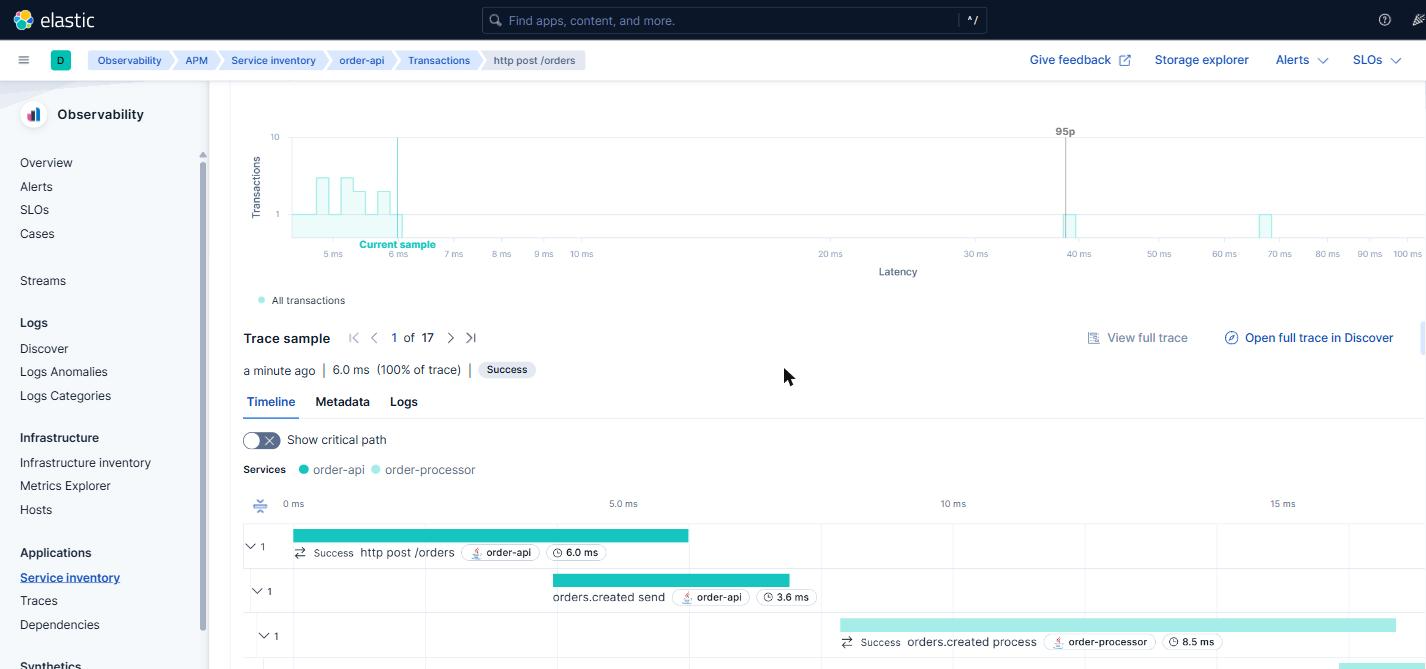
Five spans, two JVMs, a Kafka broker in the middle, a database underneath. All sharing the same trace_id. That’s the payoff of the whole exercise: you can follow the full path of a request through the system even though it crossed processes, even though it went through Kafka, even though it waited in a queue.
Every log emitted during that flow carries the same trace_id in the MDC. Filtering by it in Kibana shows everything that happened during the lifetime of that request, in chronological order, across both services at once.
From here on the post has two parallel sections. The same demo, running against two different stacks: ELK on one side, Tempo + Loki + Prometheus + Grafana on the other. The Java apps don’t change. What changes is where the Collector exports to.
The demo on GitHub ships with both overlays:
# ELK
docker compose -f docker-compose.yml -f docker-compose.elk.yml up -d

# Grafana
docker compose -f docker-compose.yml -f docker-compose.grafana.yml up -d
Mutually exclusive (they collide on the Collector’s OTLP ports). Section 08 shows the actual difference between them.
06 — Backend A: ELK with the EDOT Collector
Apps emitting OTLP, a Collector as aggregator, Elasticsearch + Kibana behind. What sets this stack apart from the OSS Collector is the EDOT distribution (Elastic Distribution of OpenTelemetry): a regular Collector with two components added by Elastic that make Kibana understand OTel data as “APM transactions” instead of generic spans.
With EDOT, the Observability → APM tab in Kibana fills itself: service inventory, latencies, throughput, top errors, drilldown into a specific trace, trace ↔ log correlation in the same panel. Without building anything.
The Service Map (the graph of service dependencies) is the only piece that requires a Platinum license. The rest works with basic.
The two components EDOT adds on top of the OSS Collector:
- The
elasticapmprocessor: enriches spans with attributes the Kibana APM tab expects (things liketransaction.type,processor.event,transaction.duration.us). That’s what makes Kibana treat the data as “APM transactions” instead of generic spans. - The
elasticapmconnector: turns spans into pre-aggregated metrics (latencies, throughput, error rates per service) and publishes them to indices the APM tab consumes directly.
Without these two components, the OTel data would still reach Elasticsearch, but it would only show up as raw documents in Discover. The APM tab would have no idea about it.
The Collector configuration changes quite a bit from the vanilla one. The apps don’t — they still send OTLP to otel-collector:4318 as before:
receivers:
  otlp:
    protocols:
      grpc: { endpoint: 0.0.0.0:4317 }
      http: { endpoint: 0.0.0.0:4318 }

processors:
  memory_limiter:
    check_interval: 1s
    limit_mib: 512
  batch:
    timeout: 2s
  elasticapm: {}
  # Enriches Micrometer metrics (JVM heap, GC, threads) with the
  # attributes the Kibana APM Metrics tab expects. Without this
  # processor, metrics exist in `metrics-*` but the Metrics tab
  # stays empty because Kibana expects the legacy APM Java agent
  # format (`metricset.name: app`).
  transform/apm-metrics:
    metric_statements:
      - context: datapoint
        conditions:
          - resource.attributes["telemetry.sdk.name"] == "io.micrometer"
        statements:
          - set(attributes["metricset.name"], "app")
          - set(attributes["processor.event"], "metric")

connectors:
  elasticapm: {}

exporters:
  elasticsearch/otel:
    endpoints: ["${env:ELASTICSEARCH_URL}"]
    user: "${env:OTEL_COLLECTOR_USERNAME}"
    password: "${env:OTEL_COLLECTOR_PASSWORD}"
    mapping:
      mode: otel

service:
  pipelines:
    traces:
      receivers: [otlp]
      processors: [memory_limiter, elasticapm, batch]
      exporters: [elasticapm, elasticsearch/otel]
    metrics/intake:
      receivers: [otlp]
      processors: [memory_limiter, transform/apm-metrics, batch]
      exporters: [elasticsearch/otel]
    metrics/aggregated:
      receivers: [elasticapm]
      exporters: [elasticsearch/otel]
    logs:
      receivers: [otlp]
      processors: [memory_limiter, elasticapm, batch]
      exporters: [elasticsearch/otel]
What matters in this configuration:
mapping.mode: otelin the exporter. It tells Elasticsearch to use the native OTel mapping instead of the legacy ECS one.- The
elasticapmconnector appears as receiver of themetrics/aggregatedpipeline. That’s how the pre-aggregated metrics (latencies, throughput, error rates per service) flow into the indices that populate the APM Services/Transactions tab. - The
transform/apm-metricsprocessor on themetrics/intakepipeline translates Micrometer metrics into the convention the Kibana APM Metrics tab expects. More on that next.
The missing mapping: Micrometer vs OTel semantic conventions
Spring Boot 4 emits JVM metrics via Micrometer. The Kibana APM Metrics tab, in contrast, expects the OpenTelemetry semantic conventions for Java (inherited from the legacy Elastic APM Java agent). The two conventions look similar but aren’t the same: different names, different attributes, different enum values. Result: if you export Micrometer “as is” to Elasticsearch, the APM Metrics tab shows up empty or with broken panels, even though the data is in metrics-*.
The fix lives in the transform/apm-metrics processor and it’s this:
transform/apm-metrics:
  metric_statements:
    - context: resource
      conditions:
        - attributes["telemetry.sdk.name"] == "io.micrometer"
      statements:
        - set(attributes["agent.name"], "opentelemetry/java")
        - set(attributes["service.framework.name"], "org.springframework.boot")
        - set(attributes["service.instance.id"], attributes["service.name"]) where attributes["service.instance.id"] == nil
        - set(attributes["host.name"], attributes["service.name"]) where attributes["host.name"] == nil

    - context: datapoint
      conditions:
        - resource.attributes["telemetry.sdk.name"] == "io.micrometer"
      statements:
        - set(attributes["metricset.name"], "app")
        - set(attributes["processor.event"], "metric")
        - set(attributes["jvm.memory.type"], "heap") where attributes["area"] == "heap"
        - set(attributes["jvm.memory.type"], "non_heap") where attributes["area"] == "nonheap"
        - set(attributes["jvm.memory.pool.name"], attributes["id"]) where attributes["id"] != nil
        - set(attributes["jvm.thread.state"], attributes["state"]) where attributes["state"] != nil

    # Metric renames (each block is metric.name → another)
    - context: metric
      conditions: [name == "process.cpu.usage"]
      statements: [set(name, "jvm.cpu.recent_utilization")]
    - context: metric
      conditions: [name == "jvm.memory.max"]
      statements: [set(name, "jvm.memory.limit")]
    - context: metric
      conditions: [name == "jvm.memory.usage.after.gc"]
      statements: [set(name, "jvm.memory.used_after_last_gc")]
    - context: metric
      conditions: [name == "jvm.classes.loaded"]
      statements: [set(name, "jvm.class.count")]
    # threads.live + threads.daemon → a single jvm.thread.count with dimension
    - context: datapoint
      conditions: [metric.name == "jvm.threads.daemon"]
      statements: [set(attributes["jvm.thread.daemon"], true)]
    - context: datapoint
      conditions: [metric.name == "jvm.threads.live"]
      statements: [set(attributes["jvm.thread.daemon"], false)]
    - context: metric
      conditions: [name == "jvm.threads.live" or name == "jvm.threads.daemon"]
      statements: [set(name, "jvm.thread.count")]
What I learned wiring this block up and never saw documented:
-
The “agent” is detected via resource attribute, not via the metric. Without
agent.name: opentelemetry/java, Kibana shows “Runtime metrics not available for this Agent / SDK type”, even if the metrics exist. The curious bit: this attribute is sometimes inferred from the traces, so a service with many HTTP traces works out-of-the-box while another one with only messaging traces doesn’t — Kibana’s own inconsistencies. -
service.instance.idandhost.namehave to come in the resource or Kibana’s columns show(null). Apps can set them viaOTEL_RESOURCE_ATTRIBUTES, but$HOSTNAMEdoesn’t expand inside docker-compose. We inject them in the Collector usingservice.nameas fallback — in production they’ll come from the actual pod/host. -
The memory area enum differs: Micrometer uses
nonheap(no underscore), Kibana expectsnon_heap. So we normalize it explicitly. -
Some metrics Micrometer emits as separate counters, Kibana expects as a single metric with a dimension. That’s the case for
jvm.threads.live+jvm.threads.daemon→jvm.thread.countwith attributejvm.thread.daemon: true/false. -
Once Elasticsearch pins a metric type in its mapping (gauge / counter), it doesn’t change. If you rename a counter metric to a name you later want to be a gauge, the old mapping persists and the panels fail with
argument of [AVG(...)] must be ... type [counter_double]. Solution:DELETE /_data_stream/metrics-...and let it recreate with the new type.
With this block, the APM Metrics tab renders JVM heap, GC, threads, classes loaded and memory pools on both services. Without it, it’s empty.
Observability over the database and the broker
The apps emit traces and client-side metrics. But the database and the broker have a life of their own and are equally critical pieces — you don’t see them from inside the app.
The EDOT Collector ships with a postgresqlreceiver that connects directly to the Postgres server and scrapes 19 dimensional metrics: active connections, commits, rollbacks, blocks read, bgwriter, db size, index scans, table vacuum. Four lines in the Collector config:
receivers:
  postgresql:
    endpoint: postgres:5432
    username: ${env:POSTGRES_USER}
    password: ${env:POSTGRES_PASSWORD}
    databases: [orders]
    collection_interval: 30s
The metrics show up in their own data stream (metrics-postgresqlreceiver.otel-default) and are filterable in Discover by data_stream.dataset: postgresqlreceiver.otel. A DB health dashboard takes five minutes in Lens.
For Kafka, things aren’t as clean. The apps already emit everything you need on the client side: kafka.producer.* and kafka.consumer.* (throughput, commit latencies, rebalance events, connections, ~50 metrics). For broker-level metrics (request handlers, ISR, partitions count, log size), the only clean option today is to run a JMX exporter as a sidecar — EDOT 9.3.4 doesn’t include kafkametricsreceiver, and the jmx receiver in the contrib is deprecated. In the demo we don’t include it to keep docker-compose short; in production it’s another sidecar.
For Kibana to show containers in the Infrastructure → Containers tab (what other stacks would call “host inventory”), the Collector also includes the docker_stats receiver:
docker_stats:
  endpoint: unix:///var/run/docker.sock
  collection_interval: 30s
And the service mounts the Docker socket read-only:
otel-collector:
  volumes:
    - /var/run/docker.sock:/var/run/docker.sock:ro
The metrics ride to Elasticsearch and are browsable in Discover.
An honest caveat I found trying to surface these in the Kibana Infrastructure inventory. The first instinct is: “these are container metrics, I should see them on the Observability → Infrastructure waffle map”. The problem is that this UI doesn’t yet support OTel-native data in 9.3.4. The reason isn’t the index name — it’s that the field list the UI queries is hardcoded to the Metricbeat integration:
| The UI expects | OTel-native data emits |
|---|---|
docker.container.id | container.id (semconv) |
docker.cpu.total.pct | container.cpu.utilization |
docker.memory.usage.pct | container.memory.percent |
metricset.module: "docker" | (doesn’t apply to OTel) |
Forcing it would mean duplicating every metric under the Metricbeat name — reimplementing Metricbeat inside the Collector. That makes no sense. Elastic is making OTel a core part of the stack and OTel-native support for the Infrastructure UI is on the roadmap, but it’s not in 9.3.4 yet. It’s very much a transitional case: the deep integration with OTel is already there for APM, Logs and Traces; Infrastructure isn’t there yet.
The idiomatic way to visualize infra metrics from OTel-native data today is a custom Lens dashboard, which is exactly what we’ll see in the next section.
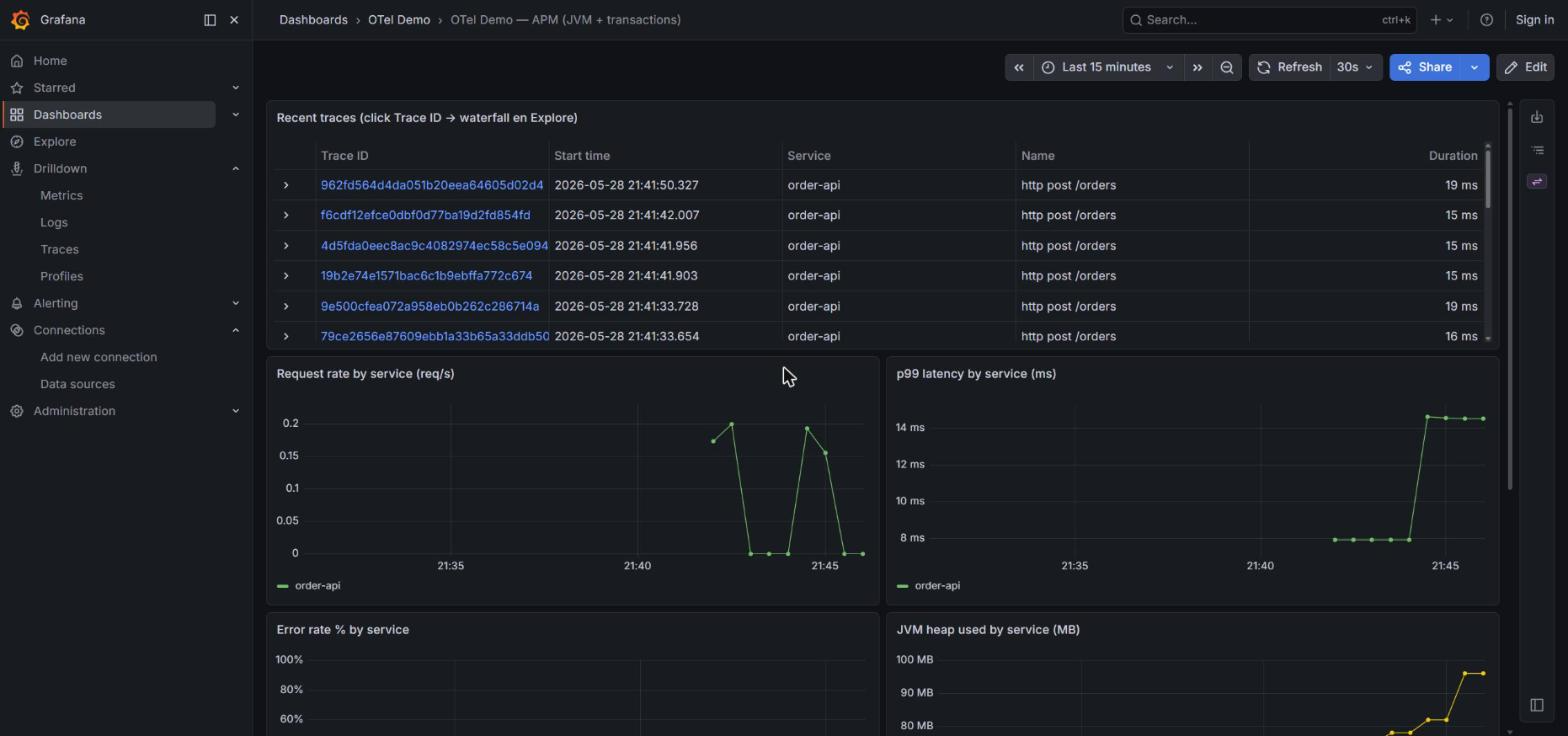
Pre-loaded dashboard at startup
The APM Metrics tab gives you charts for each Java service. For views that span layers — “DB connections + record send rate + consumer lag” on the same screen — you need to build a dashboard. That’s what separates having observability from having it usable.
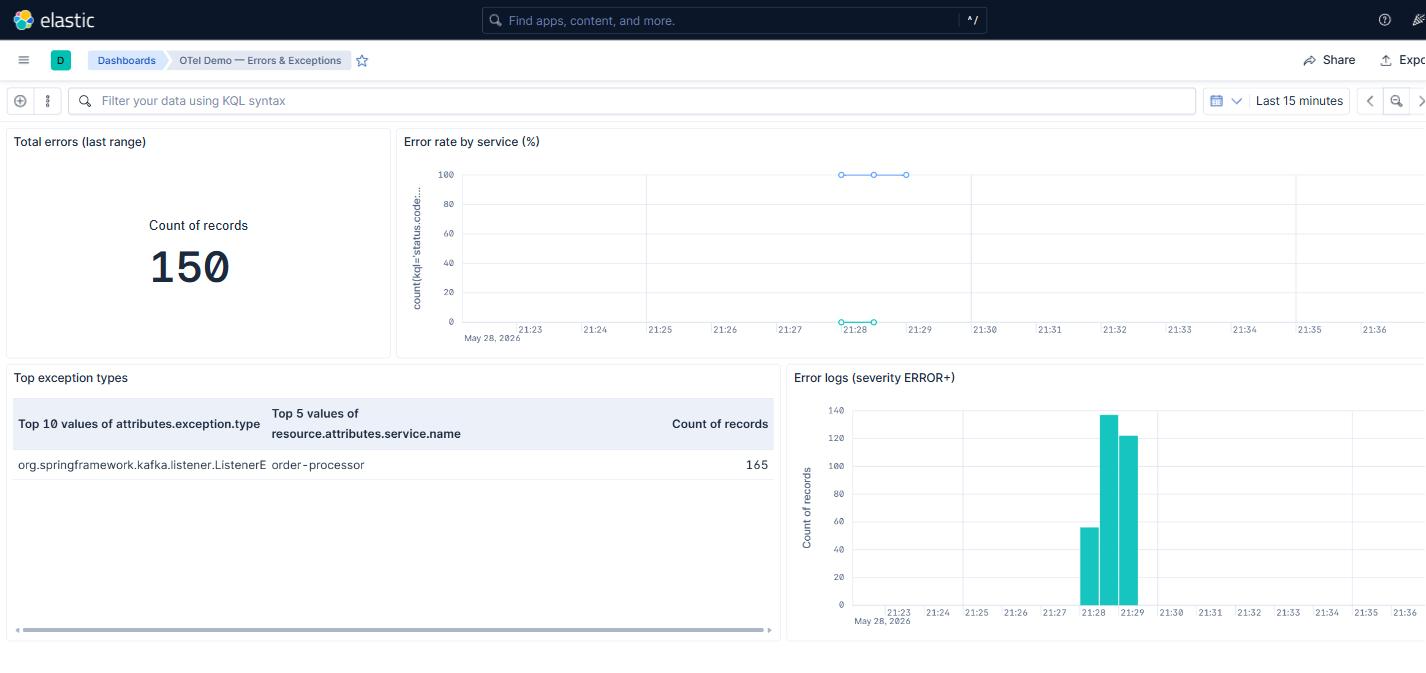
In the demo all of that is automatic. The kibana-setup service (which already creates the data views at startup) also imports two pre-built dashboards. The first one, “OTel Demo — Infra (Postgres + Kafka)”: six Lens panels with active connections, commits/rollbacks, blocks read, DB size, producer record send rate per service, and max consumer lag. The second one, “OTel Demo — Errors & Exceptions”, complements the built-in tab: total errors, error rate per service, top exception types, and a stream of ERROR logs with stack trace alongside. The definitions live in elk/kibana/dashboards.ndjson and elk/kibana/errors-dashboard.ndjson, and both are mounted into the setup container:
kibana-setup:
  volumes:
    - ./elk/kibana/setup.sh:/setup.sh:ro
    - ./elk/kibana/dashboards.ndjson:/dashboards.ndjson:ro
    - ./elk/kibana/errors-dashboard.ndjson:/errors-dashboard.ndjson:ro
The script imports them with ?overwrite=true (idempotent). When you clone the repo and run docker compose up, the “OTel Demo — Infra” dashboard shows up on its own in Kibana → Dashboards. No manual steps, no remembering what to drag onto which axis.
To iterate on the dashboard: edit it in Kibana, export it from Stack Management → Saved Objects, replace the NDJSON in the repo. Next up boots with the new version. It’s the “GitOps for observability” pattern — the dashboard configuration travels with the code.
A stone I tripped over: network.host in Elasticsearch
Elasticsearch 9.x by default only listens on localhost inside the container. If you start another container (Kibana, the EDOT Collector) on the same Docker network and point it at http://elasticsearch:9200, you get “Connection refused” until you add this to elasticsearch.yml:
network.host: 0.0.0.0Trivial when you know it. An hour gone when you don’t. Leaving it here in case it saves someone the pain.
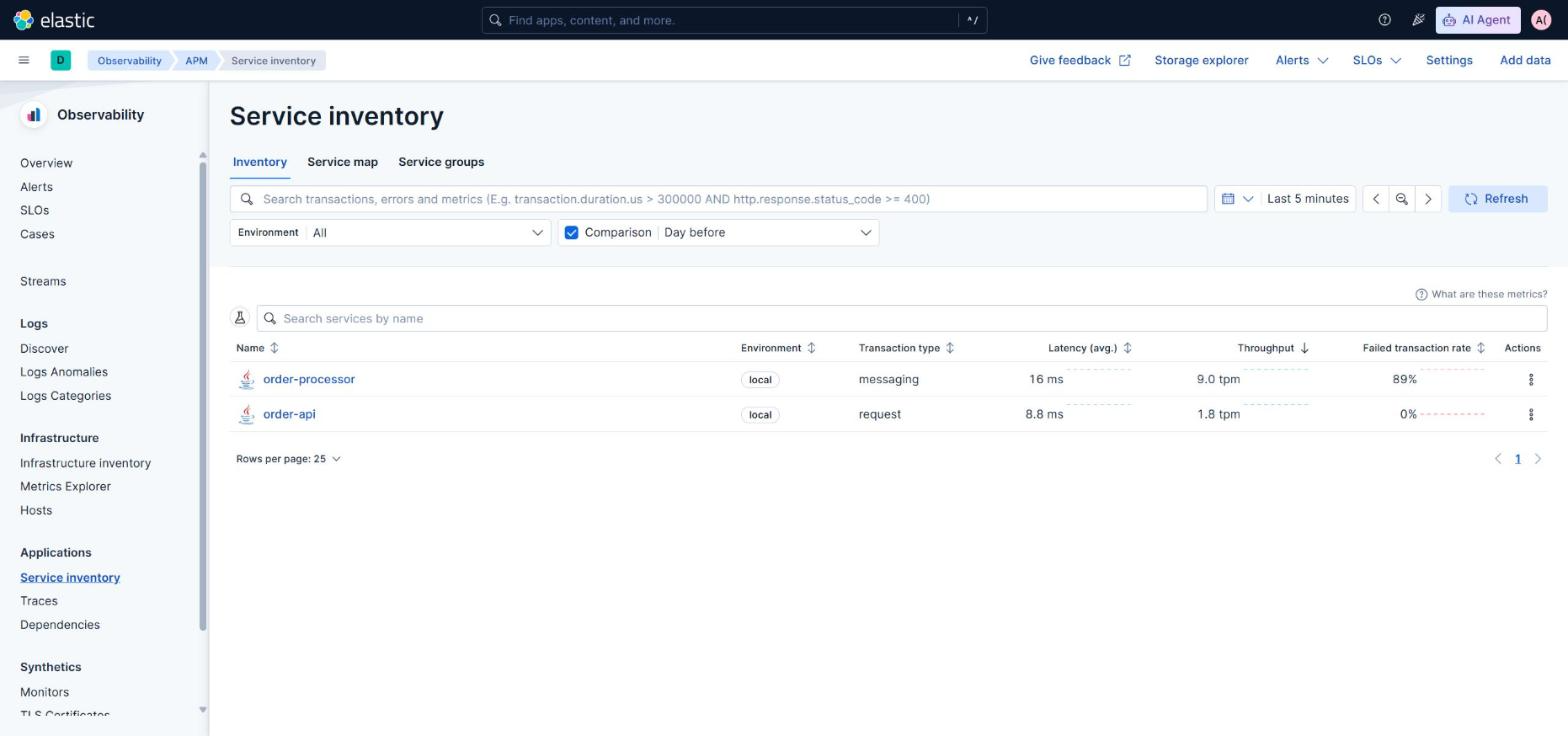
With everything running, in Kibana → Observability → APM both services appear on their own. Click order-api, click http post /orders, click the sample trace and the full waterfall of five spans across both JVMs shows up. The trace ↔ log correlation lives in a tab inside the same trace: three logs of the flow, filtered by trace_id, in chronological order. Without building anything.
And the two pre-loaded dashboards complement the built-in APM tab with cross-layer views. The errors one groups by exception type with a stream of ERROR logs alongside:
07 — Backend B: Tempo + Loki + Prometheus + Grafana
Same apps, same Collector as aggregator, different backends behind. Four components instead of two, all OSS:
- Tempo for traces. Native OTLP on
:4317/:4318, TraceQL as the query engine. On top of that, itsmetrics_generatorcan emit pre-aggregated metrics from spans (latency, error rate, edges of the service graph) and push them to Prometheus. - Loki for logs. Native OTLP receiver (since 3.0). Needs
allow_structured_metadata: truein its config — without it, the OTel attributes on the log (trace_id, severity_text, code_filepath) get dropped at ingestion and the logs end up as raw JSON. - Prometheus for metrics. Has a native OTLP receiver since 2.55, enabled with the
--web.enable-otlp-receiverflag. You don’t need Mimir or anything bigger for a demo or a moderate volume. - Grafana as a single UI for all three datasources.
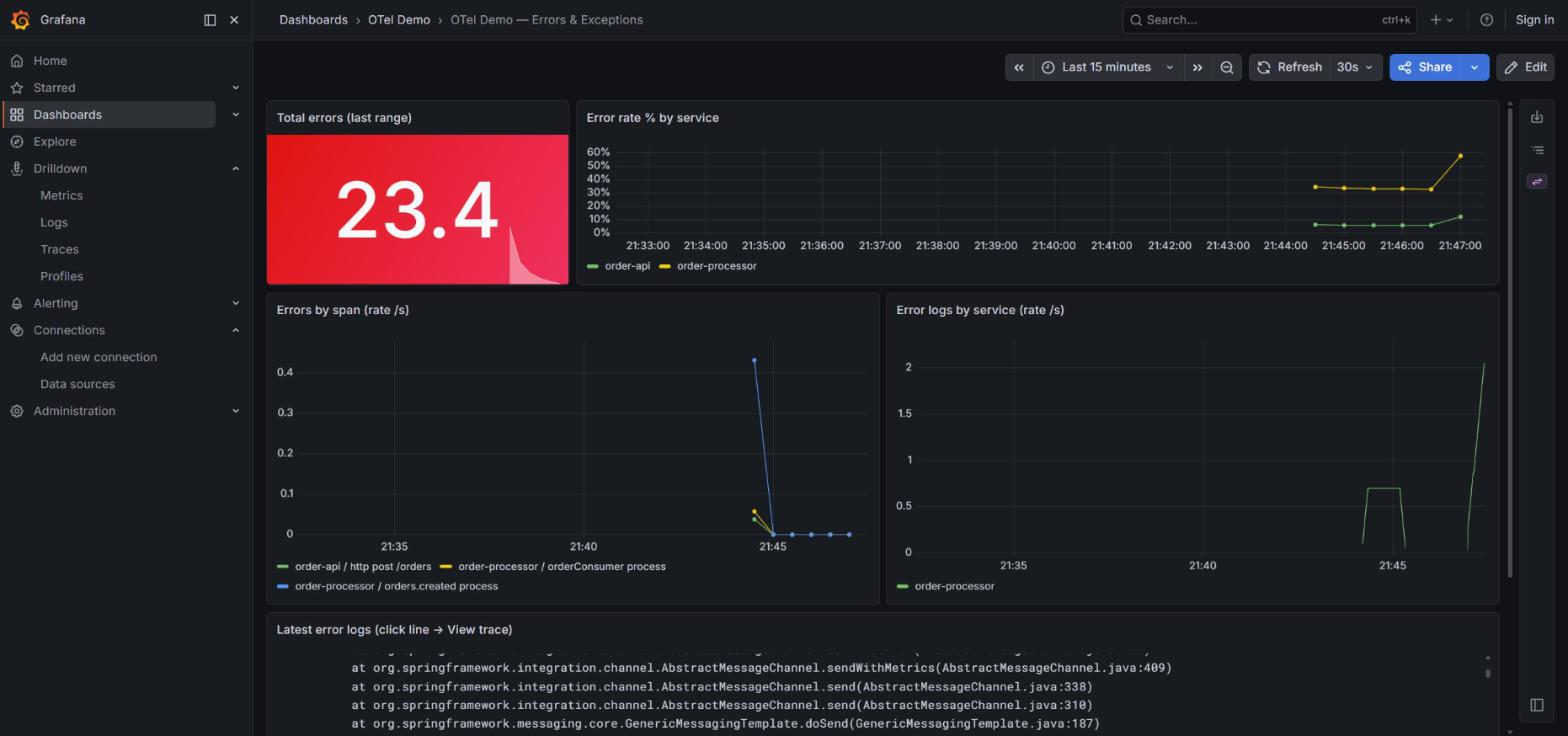
The Kibana APM-equivalent tab isn’t built-in here: you build a Lens-style dashboard yourself. That’s extra work, but it’s also the “observability as code” pattern — the dashboard lives in Git and is versioned alongside the rest of the repo. In the demo we keep it pre-loaded: Grafana boots with three dashboards ready (APM/JVM/transactions, Errors & Exceptions, Infra Postgres + Kafka) without touching the UI.
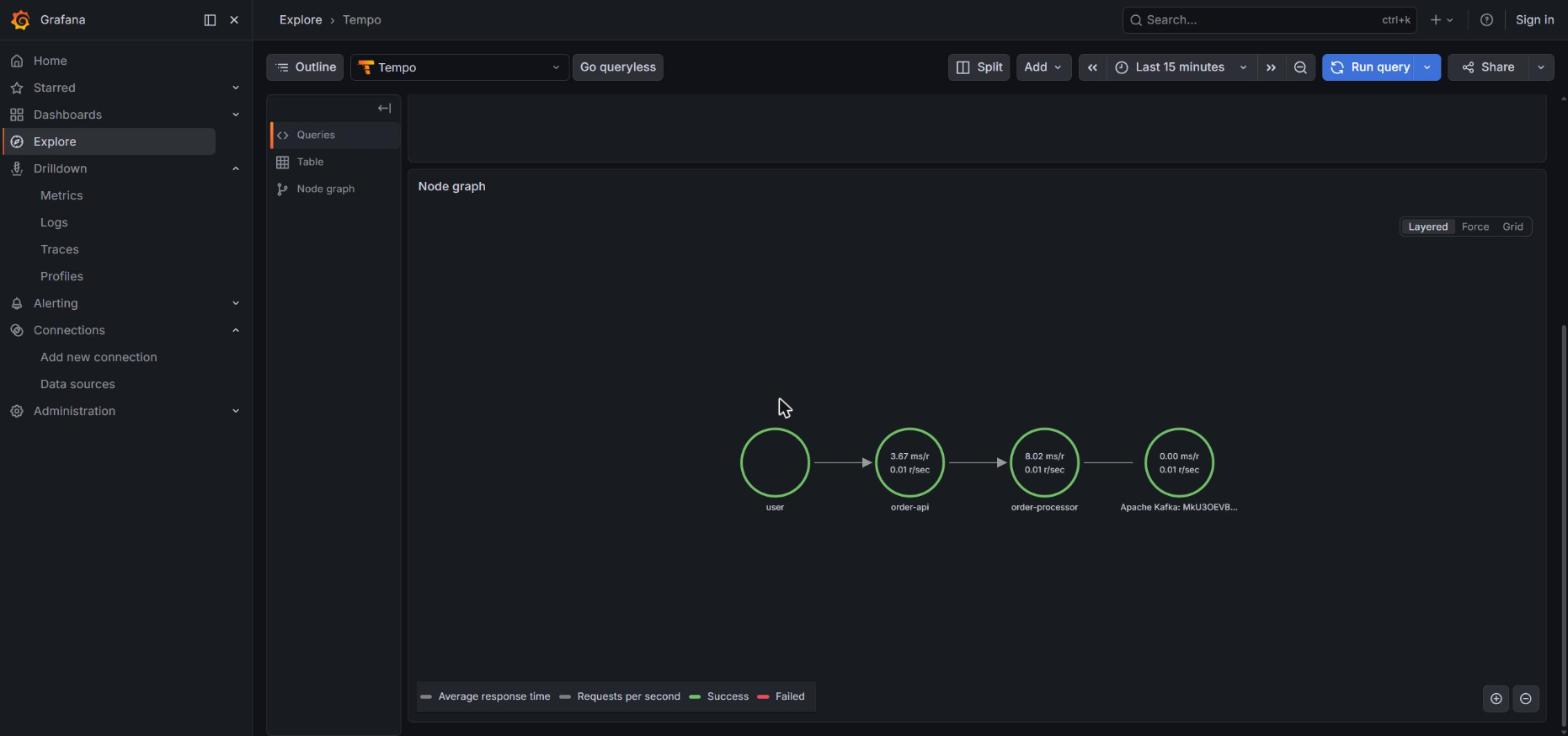
Where Grafana shines compared to ELK is the Service Map: the service-graphs processor in Tempo’s metrics_generator emits the graph edges as metrics, and Grafana draws them as connected nodes (user → order-api → Kafka:orders.created → order-processor → Kafka:orders.processed). No licenses.
Aside from the dashboard, there are three “Drilldown” apps in the Grafana side menu — Metrics, Logs and Traces — which are to Prometheus/Loki/Tempo what Discover is to Kibana: exploration without writing queries. The three auto-detect datasources and start with panels auto-generated per service. Useful when you don’t know yet what to look for.
Cross-signal correlation works but you configure it. The Loki datasource in provisioning carries a derivedFields block that extracts trace_id from logs and links to Tempo; the Tempo one carries tracesToLogsV2 pointing to Loki; Prometheus exposes exemplars that link metrics to the traces that produced them. Once on, clicking a log opens the trace; clicking a span opens the logs of the span. The behavior is the same as Kibana — the difference is that Kibana ships it configured and here it’s versioned in a YAML.
Where Grafana asks for more work today:
- Four operational components instead of one. Different config languages, different storage models, different backups.
- Three different query languages: TraceQL, LogQL, PromQL. The team learns all three.
- No built-in equivalent of the Kibana APM Errors UI. The errors exist (spans with
STATUS_CODE_ERRORandattributes.exception.typeare in Tempo), but you build the panel — which is what we do in the demo’s custom errors dashboard.
08 — What actually changes between the two
The operational argument of this post: the apps don’t notice which of the two backends sits behind. Same pom.xml, same application.yml, same OTEL_RESOURCE_ATTRIBUTES. Same handlers, same annotations, same Logback appender.
The only thing that changes is a single file: the Collector configuration. And inside that file, almost everything stays the same — only the exporters block changes, and how they plug into the pipelines.
Side by side, the exporters for each stack:
# ELK
exporters:
  elasticsearch/otel:
    endpoints: ["${env:ELASTICSEARCH_URL}"]
    user: "${env:OTEL_COLLECTOR_USERNAME}"
    password: "${env:OTEL_COLLECTOR_PASSWORD}"
    mapping:
      mode: otel

# Grafana
exporters:
  otlp/tempo:
    endpoint: tempo:4317
    tls:
      insecure: true
  otlphttp/loki:
    endpoint: http://loki:3100/otlp
    tls:
      insecure: true
  otlphttp/prometheus:
    endpoint: http://prometheus:9090/api/v1/otlp
    tls:
      insecure: true
The receivers (OTLP, postgresql, docker_stats) are identical. The processors (memory_limiter, resource, batch) too. The only simplification on the Grafana side is that it doesn’t need elasticapm or transform/apm-metrics — those were specific adapters so Kibana understood the data as APM.
If you decide to change vendor tomorrow: you edit that file, not the apps. If tomorrow you want to send traces to Datadog, metrics to Mimir and logs to Loki, it’s three different exporters blocks and a repaint of the pipelines. The apps keep emitting OTLP without noticing.
That’s the real promise of OpenTelemetry, and it’s demonstrated in less than 20 lines of YAML.
And you can see it: the same demo, a different stack, a different UI, the same signals with the same fidelity. The errors dashboard in Grafana tells the same story as the Kibana one — the code doesn’t change:
09 — What still doesn’t convince me
Things the setup still doesn’t solve, equally in both stacks:
Collector configuration as it grows. The YAML above is simplified. In production you end up with multiple receivers, per-service filters, attribute transforms, tail-based sampling, batching, retry with persistent queue, different pipelines per signal type. A lot of YAML, no types, no easy tests. Governance of the Collector as critical infrastructure is something I’m still figuring out how to handle well.
Consumer-side propagation in Spring Cloud Stream Kafka. Today it has to be done by hand (section 04). It’s a patch, not a solution. When Spring Cloud Stream closes this gap, the manual extraction block goes away. Until then, it’s the price you pay for not using the Java agent.
The Micrometer ↔ OTel semconv mapping (ELK only). About 30 lines of OTTL in the Collector. While Spring keeps emitting via Micrometer and Kibana keeps expecting OTel semconv, the mapping will be necessary. Stable but ugly: every time you bump Spring Boot, you double-check it hasn’t broken.
Kafka broker metrics. No OTel-native receiver today. To watch the broker from the same pipeline you add a JMX exporter sidecar. Platform work that’s outside the app scope but very much inside the observability platform scope.
Infrastructure UI with OTel-native data, both sides. Kibana 9.4.1 doesn’t yet support the Infrastructure → Hosts/Containers tab with OTel-native data — the UI expects Metricbeat fields. In Grafana the equivalent tab (the Infrastructure subapp inside an APM service) depends on the hostmetrics receiver running near the service, which doesn’t fit a Docker Compose setup with a central Collector. In real K8s it should work, thanks to k8sattributesprocessor — but the demo runs on Docker Compose.
Patterns that aren’t HTTP or Kafka. @Scheduled gets traced automatically by the starter, but the span gets a generic name — worth renaming it, and if there’s a loop inside over many entities, opening a sub-span per iteration by hand. SSE: since it’s HTTP, the starter opens a span per connection, but that span lives as long as the stream — minutes or hours — and individual events don’t show up separately unless you open a child span in the callback that writes each chunk. WebSocket: the handshake (HTTP upgrade) traces fine; individual messages — @MessageMapping, STOMP frames — don’t, and need @Observed or an interceptor. Spring Batch traces job and step, chunks rarely. None blocks, but all require “configure by hand” to some degree.
None of these is blocking. What this section does is dismiss the idea that adding the starter is enough — the work in section 04 still exists.
10 — To wrap up
The important change OpenTelemetry brings is conceptual, not technical. Before, deciding how to instrument an application meant choosing a vendor before you even started and locking yourself in. Now the decision is different: you instrument with OpenTelemetry, you pick the backend later, and that backend choice can change without touching the application code.
This post deliberately doesn’t recommend one over the other. ELK gets you to a complete APM tab faster without building anything — at the cost of a license for pieces like the Service Map. Grafana gives you Service Map for free and a full OSS ecosystem — at the cost of operating four components and building yourself what ELK ships with. Both options are valid and the sensible decision is operational: what the team knows, what budget you have, what you already run for other things. What shouldn’t weigh in that decision is the application code, because the code doesn’t change.
The demo is at github.com/ujados/otel-observability-demo. It ships three docker-compose files: the base one with the vanilla Collector writing to console, the elk.yml override with EDOT + Elasticsearch + Kibana, and the grafana.yml override with Tempo + Loki + Prometheus + Grafana. Clone it, boot it in either backend, send requests, watch the trace_id flow end to end. Then switch overrides and do it again — without touching the apps. Seeing that portability in motion is much clearer than reading about it.